
Assignment 1 - Python Basics Practice

As you go through this notebook, you will find the symbol ??? in certain places. To complete this assignment, you must replace all the ??? with appropriate values, expressions or statements to ensure that the notebook runs properly end-to-end.
Guidelines
- Make sure to run all the code cells, otherwise you may get errors like
NameErrorfor undefined variables. - Do not change variable names, delete cells or disturb other existing code. It may cause problems during evaluation.
- In some cases, you may need to add some code cells or new statements before or after the line of code containing the ???.
- Questions marked (Optional) will not be considered for evaluation, and can be skipped. They are for your learning.
- If you are stuck, you can ask for help. Post errors, ask for hints and help others, but please don't share the full solution answer code to give others a chance to write the code themselves.
- After submission your code will be tested with some hidden test cases. Make sure to test your code exhaustively to cover all edge cases.
This tutorial is an executable Jupyter notebook. Click the Open in Colab button at the top of this page to execute the code.
Jupyter Notebooks: This notebook is made of cells. Each cell can contain code written in Python or explanations in plain English. You can execute code cells and view the results instantly within the notebook. Jupyter is a powerful platform for experimentation and analysis. Don't be afraid to mess around with the code & break things - you'll learn a lot by encountering and fixing errors. You can use the "Kernel > Restart & Clear Output" menu option to clear all outputs and start again from the top.
Problem 1 - Variables and Data Types
Q: Assign your name to the variable name.
name = ???Q: Assign your age (real or fake) to the variable age.
age = ???Q: Assign a boolean value to the variable has_android_phone.
has_android_phone = ???You can check the values of these variables by running the next cell.
name, age, has_android_phoneQ: Create a dictionary person with keys "Name", "Age", "HasAndroidPhone" and values using the variables defined above.
person = ???Let's use the person dictionary to print a nice message.
print("{} is aged {}, and owns an {}.".format(
    person["Name"],
    person["Age"],
    "Android phone" if person["HasAndroidPhone"] else "iPhone"
))
Q (Optional): Use a for loop to display the type of each value stored against each key in person.
Here's the expected output for the key "Name":
The key "Name" has the value "Derek" of the type "<class 'str'>"
# this is optional
???
Problem 2 - Working with Lists
Q: Create a list containing the following 3 elements:
- your favorite color
- the number of pets you have
- a boolean value describing whether you have previous programming experience
my_list = ???Let's see what the list looks like:
my_listQ: Complete the following print and if statements by accessing the appropriate elements from my_list.
Hint: Use the list indexing notation [].
print('My favorite color is', ???)print('I have {} pet(s).'.format(???))if ???:
print("I have previous programming experience")
else:
print("I do not have previous programming experience")Q: Add your favorite single digit number to the end of the list using the appropriate list method.
my_list.???Let's see if the number shows up in the list.
my_listQ: Remove the first element of the list, using the appropriate list method.
Hint: Check out methods of list here: https://www.w3schools.com/python/python_ref_list.asp
my_list.???my_listQ: Complete the print statement below to display the number of elements in my_list.
print("The list has {} elements.".format(???))Problem 3 - Conditions and loops
Q: Calculate and display the sum of all the numbers divisible by 7 between 18 and 534 i.e. 21+28+35+...+525+532.
Hint: One way to do this is to loop over a range using for and use an if statement inside it.
# store the final answer in this variable
sum_of_numbers = 0

# perform the calculation here
???print('The sum of all the numbers divisible by 7 between 18 and 534 is', sum_of_numbers)Problem 4 - Flying to the Bahamas
Q: A travel company wants to fly a plane to the Bahamas. Flying the plane costs 5000 dollars. So far, 29 people have signed up for the trip. If the company charges 200 dollars per ticket, what is the profit made by the company?
Fill in values or arithmetic expressions for the variables below.
cost_of_flying_plane = ???number_of_passengers = ???price_of_ticket = ???profit = ???print('The company makes of a profit of {} dollars'.format(profit))Q (Optional): Out of the 29 people who took the flight, only 12 buy tickets to return from the Bahamas on the same plane. If the flying the plane back also costs 5000 dollars, and does the company make an overall profit or loss? The company charges the same fee of 200 dollars per ticket for the return flight.
Use an if statement to display the result.
# this is optional
???
# this is optional
if ???:
print("The company makes an overall profit of {} dollars".format(???))
else:
print("The company makes an overall loss of {} dollars".format(???))Problem 5 - Twitter Sentiment Analysis
Are your ready to perform some Data Analysis with Python? In this problem, we'll analyze some fictional tweets and find out whether the overall sentiment of Twitter users is happy or sad. This is a simplified version of an important real world problem called sentiment analysis.
Before we begin, we need a list of tweets to analyze. We're picking a small number of tweets here, but the exact same analysis can also be done for thousands, or even millions of tweets. The collection of data that we perform analysis on is often called a dataset.
tweets = [
    "Wow, what a great day today!! #sunshine",
    "I feel sad about the things going on around us. #covid19",
    "I'm really excited to learn Python with @JovianML #zerotopandas",
    "This is a really nice song. #linkinpark",
    "The python programming language is useful for data science",
    "Why do bad things happen to me?",
    "Apple announces the release of the new iPhone 12. Fans are excited.",
    "Spent my day with family!! #happy",
    "Check out my blog post on common string operations in Python. #zerotopandas",
    "Freecodecamp has great coding tutorials. #skillup"
]
Let's begin by answering a very simple but important question about our dataset.
Q: How many tweets does the dataset contain?
number_of_tweets = ???Let's create two lists of words: happy_words and sad_words. We will use these to check if a tweet is happy or sad.
happy_words = ['great', 'excited', 'happy', 'nice', 'wonderful', 'amazing', 'good', 'best']sad_words = ['sad', 'bad', 'tragic', 'unhappy', 'worst']To identify whether a tweet is happy, we can simply check if contains any of the words from happy_words. Here's an example:
sample_tweet = tweets[0]sample_tweetis_tweet_happy = False
# Get a word from happy_words
for word in happy_words:
# Check if the tweet contains the word
if word in sample_tweet:
# Word found! Mark the tweet as happy
is_tweet_happy = TrueDo you understand what we're doing above?
For each word in the list of happy words, we check if is a part of the selected tweet. If the word is indded a part of the tweet, we set the variable
is_tweet_happytoTrue.
is_tweet_happyQ: Determine the number of tweets in the dataset that can be classified as happy.
Hint: You'll need to use a loop inside another loop to do this. Use the code from the example shown above.
# store the final answer in this variable
number_of_happy_tweets = 0

# perform the calculations here
???print("Number of happy tweets:", number_of_happy_tweets)If you are not able to figure out the solution to this problem, try adding print statements inside your loops to inspect variables and make sure your logic is correct.
Q: What fraction of the total number of tweets are happy?
For example, if 2 out of 10 tweets are happy, then the answer is 2/10 i.e. 0.2.
happy_fraction = ???print("The fraction of happy tweets is:", happy_fraction)To identify whether a tweet is sad, we can simply check if contains any of the words from sad_words.
Q: Determine the number of tweets in the dataset that can be classified as sad.
# store the final answer in this variable
number_of_sad_tweets = 0

# perform the calculations here
???print("Number of sad tweets:", number_of_sad_tweets)Q: What fraction of the total number of tweets are sad?
sad_fraction = ???print("The fraction of sad tweets is:", sad_fraction)The rest of this problem is optional.
Great work, even with some basic analysis, we already know a lot about the sentiment of the tweets given to us. Let us now define a metric called "sentiment score", to summarize the overall sentiment of the tweets.
Q (Optional): Calculate the sentiment score, which is defined as the difference betweek the fraction of happy tweets and the fraction of sad tweets.
sentiment_score = ???print("The sentiment score for the given tweets is", sentiment_score)In a real world scenario, we could calculate & record the sentiment score for all the tweets sent out every day. This information can be used to plot a graph and study the trends in the changing sentiment of the world. The following graph was creating using the Python data visualization library matplotlib, which we'll cover later in the course.

What does the sentiment score represent? Based on the value of the sentiment score, can you identify if the overall sentiment of the dataset is happy or sad?
Q (Optional): Display whether the overall sentiment of the given dataset of tweets is happy or sad, using the sentiment score.
if ???:
    print("The overall sentiment is happy")
else:
    print("The overall sentiment is sad")
Finally, it's also important to track how many tweets are neutral i.e. neither happy nor sad. If a large fraction of tweets are marked neutral, maybe we need to improve our lists of happy and sad words.
Q (Optional): What is the fraction of tweets that are neutral i.e. neither happy nor sad.
# store the final answer in this variable
number_of_neutral_tweets = 0

# perform the calculation here
???
neutral_fraction = ???print('The fraction of neutral tweets is', neutral_fraction)Ponder upon these questions and try some experiments to hone your skills further:
- What are the limitations of our approach? When will it go wrong or give incorrect results?
- How can we improve our approach to address the limitations?
- What are some other questions you would like to ask, given a list of tweets?
- Try collecting some real tweets from your Twitter timeline and repeat this analysis. Do the results make sense?
Submission
To save your work, select "File" > "Save a Copy in Drive" on Google Colab. Once the copy is created, click the "Share" button and select "Anyone with the link" under the "General Access" section to make this notebook publicly accessible.
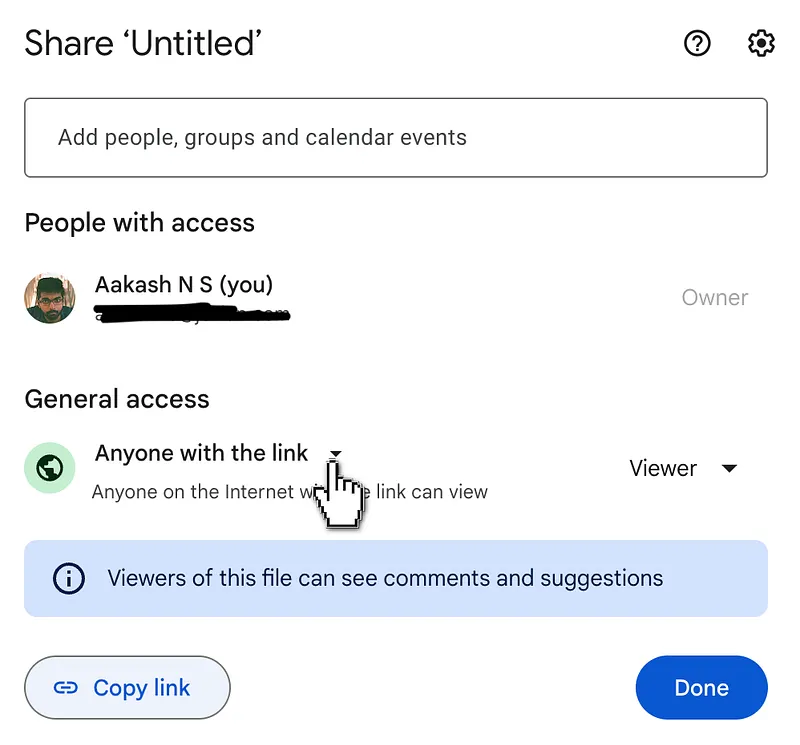
Then, copy the notebook link and submit it on the assignment page.